
Data v. Information
We are awash in data in our businesses. Most of our clients have so much data they don’t even know where to start. They collect everything … but more often than not, the insights in that data are rarely explored or delivered to leadership in a timely manner.
So many businesses pay for systems of collection and data storage that go unanalyzed, holding the secrets of better business performance if only it can be decoded. It’s a real tragedy. The challenge of decoding this data into useful information is often overwhelming, and most closely held businesses don’t have a data science department to extract, manipulate, and process this wealth of data into something useful.
Unable to solve the seemingly insoluble, many self-made business owners fall back on what got them here: their intuition and rules of thumb for performance. This fallback path is simply easier than delving down the data rabbit hole. As a visionary leader, you probably don’t have the patience for these details anyway. It’s worked to get this far, so if it ain’t broke don’t fix it, right?

Some data can be overwhelming without someone to translate it into helpful information.
Sure, you’ve gotten good results, and you can continue with the status quo.
But you probably aren’t satisfied with being average, are you?
You desire to be better. What can you do?
The real question is: what steps can you take to turn your data into information?
If you could crack the code, it would be a game-changer.
Understanding Data vs Information
When we refer to data, we are talking about rows and columns in data tables.
All the words and numbers that are collected as you run your business day-to-day.
This could be in your CRM or lead management software, your marketing software, your ERP system, your inventory management system, your POS system, or whatever else might be relevant to your industry.
When we refer to information, we are talking about usable insights and analysis that can inform business decision-making.
Information results from transforming the data collected through your systems into something useful. Few businesses have this, but those that do tend to thrive.
An Example of Collecting Data vs Decoding Information In Your Business

Decoding the data is imperative to leverage it for your business’ growth & success.
As an example, let’s consider a quoting system.
Over the years I’ve seen dozens of these across many industries. The best systems incorporate the latest data to create the best possible estimate of the true cost of producing the good or service being quoted.
Armed with this information (converted from data collected perhaps from purchase orders stored in an accounting or ERP system), management can weigh the competitive dynamics of a situation and make an informed determination of how to price the business fully informed of the likely profit margin in the event of winning the work.
On the other hand, that same company could not do the work of incorporating the latest data to understand the true cost, instead relying on rules of thumb, feel, and a “sense of the market” to arrive at a bid price.
In an information vacuum about the true cost, the quote has a price with an estimated cost and margin, but no way of knowing what the likely profit margin will be on this work. Under this scenario, if you win the work, you don’t know if it’s a cause for celebration or if you should be concerned about the winner’s curse.
Armed with information, you can have the confidence you are making informed business decisions.
Without it, you will be living in unnecessary uncertainty with its associated anxiety.
Now that we’ve established the importance of information and how it differs from data, let’s talk about two types of information: historical and predictive.
Understanding How Predictive Information & Historical Information Impacts Your Future Business
When we refer to historical information, we are talking about scorekeeping in the past. This would be information about what happened last month or last year, such as orders shipped, profit margins, financial statements, or employee turnover. This information can be useful for understanding what happened after the fact, and it can certainly be utilized to make adjustments to the plan going forward. But it did not help change the business at the moment. It simply came too late to be useful for that purpose.
When we refer to predictive information, we are talking about leveraging what we know to see the future. Backlog, sales funnel, cash flow forecast, long-range planning, and trend analysis, are types of predictive information. And very often they can be built from historical information.
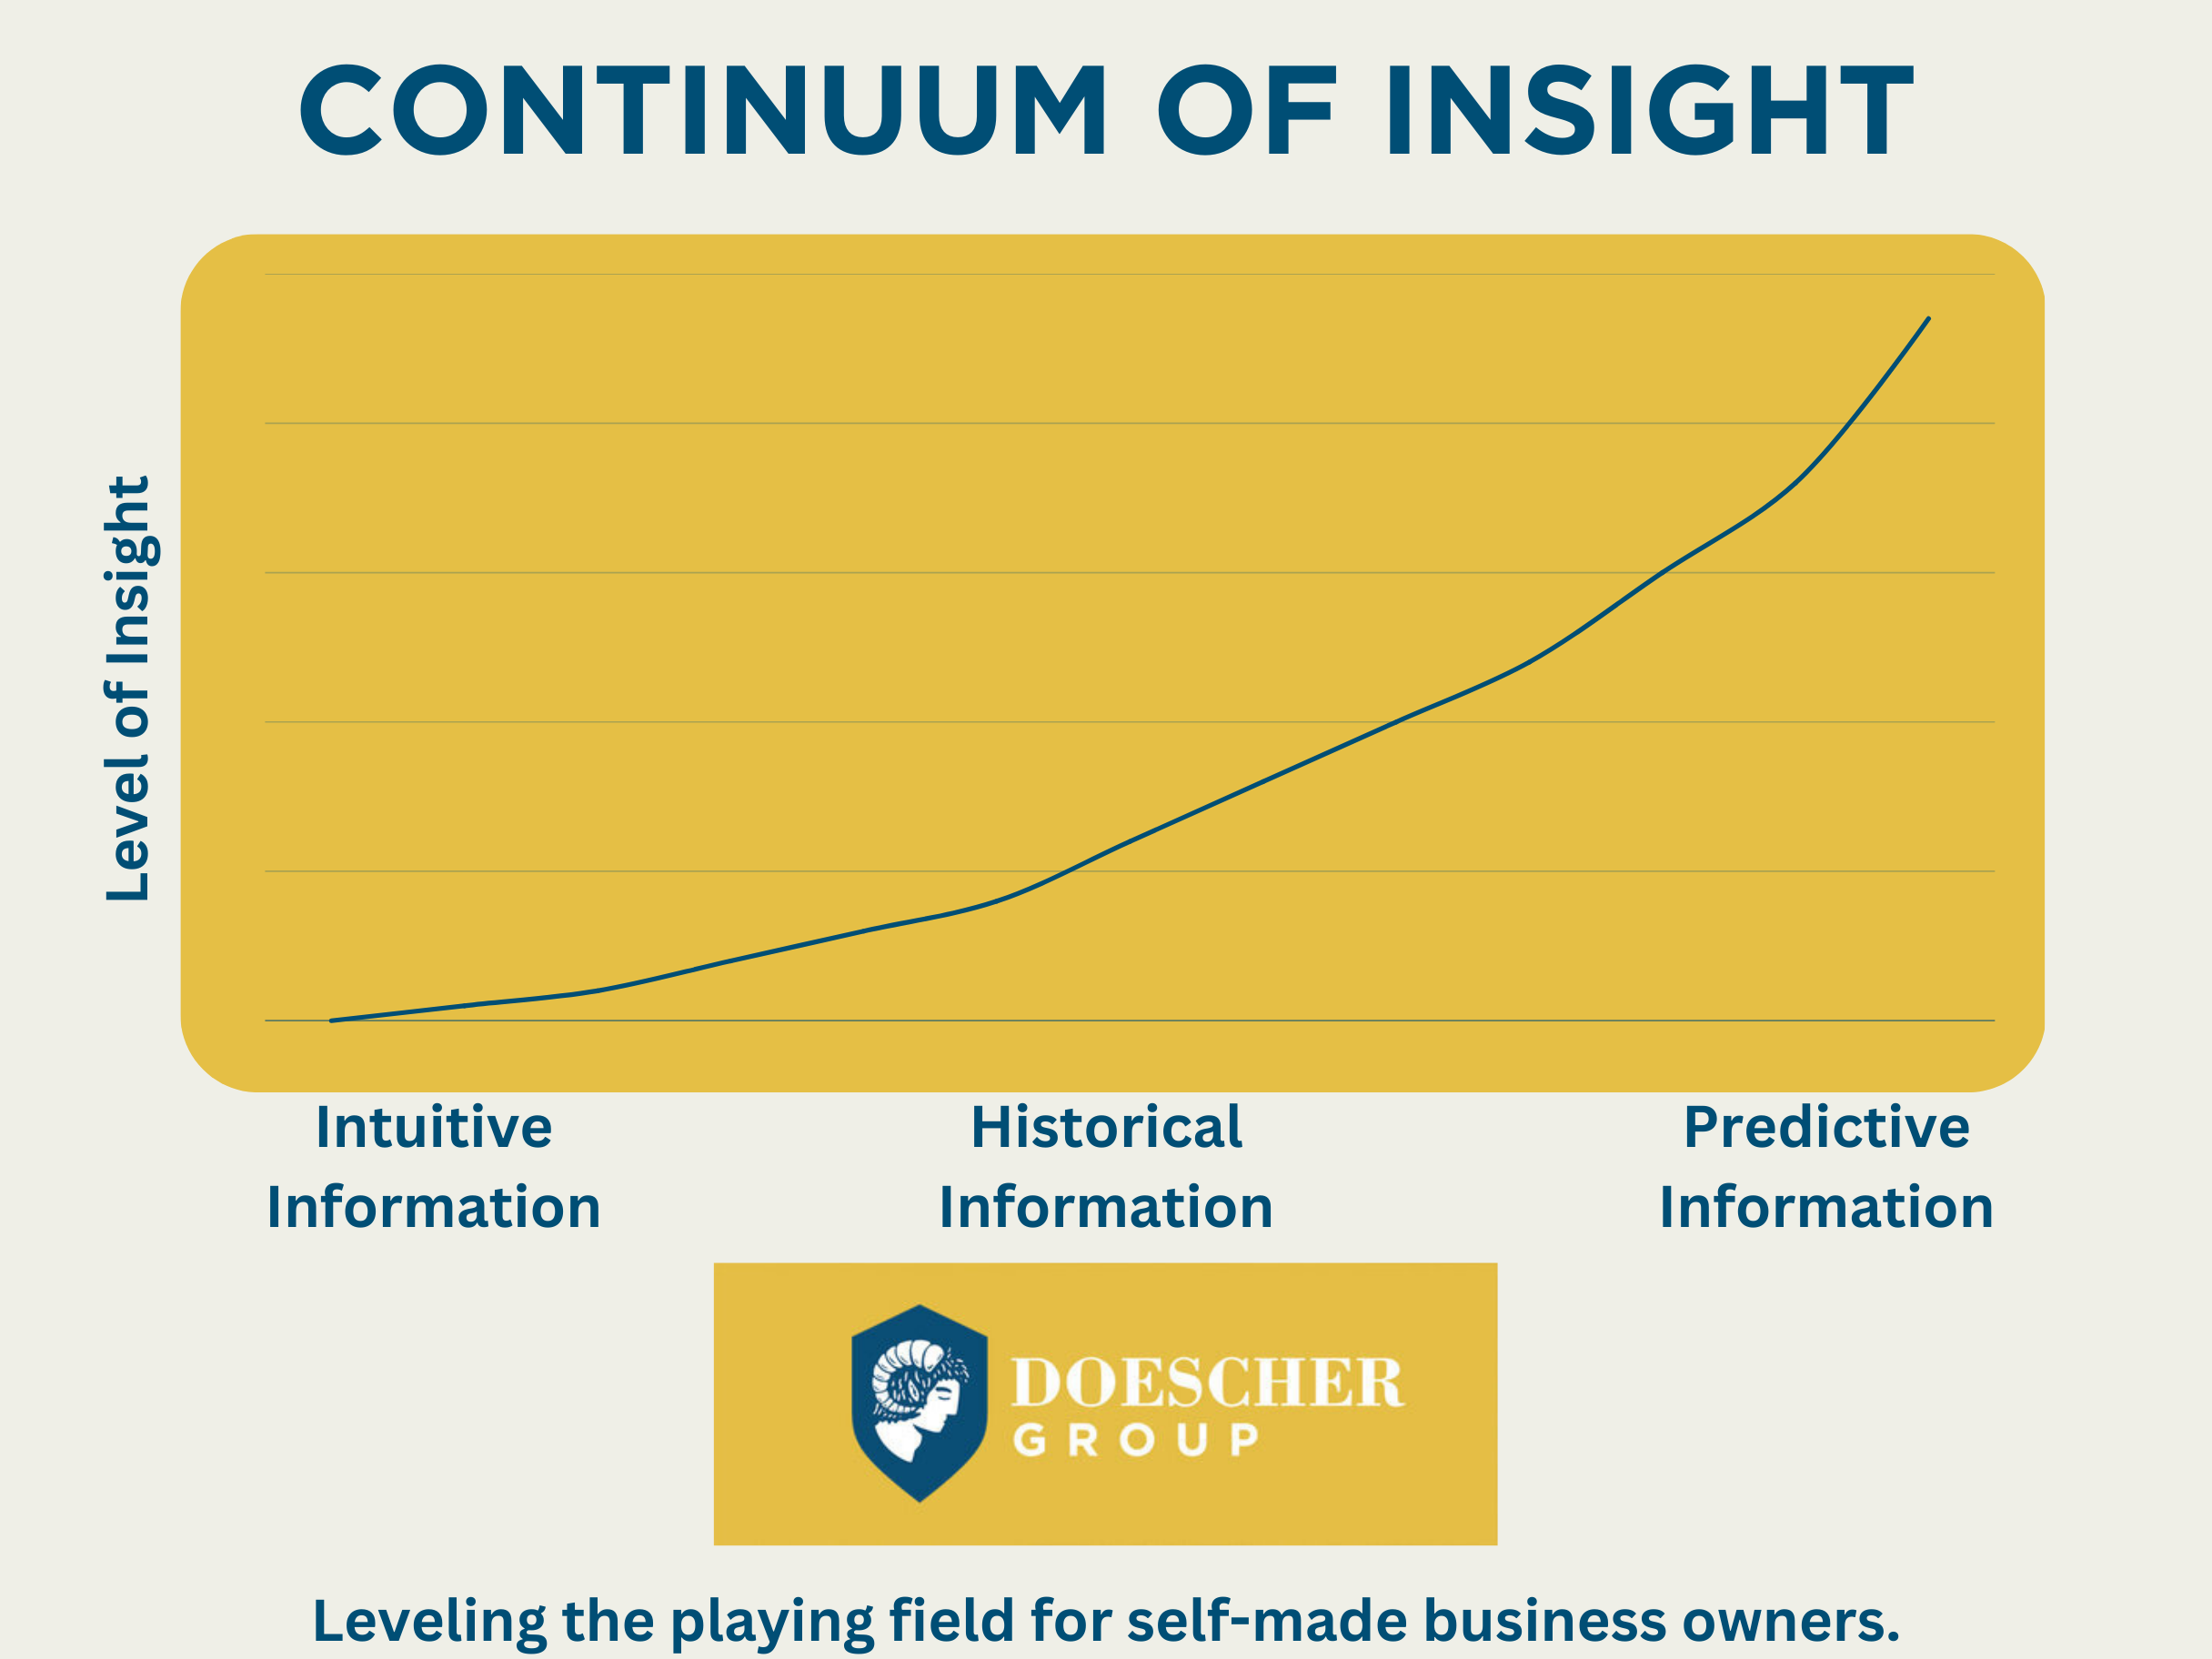
Your business can be scored along a continuum from intuitive to historical to predictive. As you move along this continuum, you will get better and better at leveraging your data for business performance.
Steps in Utilizing Your Company’s Data & Information
For many of our clients, the first step is a simple one: establishing a historical financial baseline. Starting with the accounting data, we can analyze it to get a true picture of the historical performance of the business. This can include making normalized adjustments to the profit & loss statement to eliminate items that are not reflective of business performance, such as personal expenses.
Often, another important step is developing a monthly budget or forecast for the next fiscal year. This process can teach you a lot about your company as you decide on the variables you will use to drive your forecast.
For example, let’s say that you expect a certain number of inbound calls. Of these calls, a certain percentage of them will result in a revenue-producing event. Of these revenue-producing events, you expect a certain average order value (AOV) or average selling price (ASP), at an assumed gross profit margin.
With a forecast based upon these variables: inbound calls, conversion rate, AOV, and gross profit margin, you can now see some predictive information coming to the forefront.
If the goal of the inbound calls is 100 per day and you’re hitting 75, this information is telling you something.
If your expected conversion rate is 50% and you're hitting 30%, this information is telling you something.
If your AOV is forecast to be $500 and you’re averaging $300, this information is telling you something.

Team up to transform all that data to power for the road moving forward.
Shifting from collecting underexplored data to arming you and your business with this predictive information empowers you to tweak your business operations in real-time rather than waiting for next month to see your financial results (historical information), or worse yet never doing this analysis in the first place (intuition).
Many of the brightest visionaries and business owners I know have gotten to where they are on pure grit, intuition, and hard work. However, the time comes when they are ready to reach even higher heights, and leveraging data into information can supercharge the journey.
At Doescher Group, we help businesses navigate this journey. From establishing historical financial baselines to developing predictive models, we empower our clients to leverage their data for tangible business improvements. Whether it's optimizing quoting systems for accurate pricing or fine-tuning operations based on real-time metrics, we're here to guide you every step of the way.
Don't settle for the status quo. Embrace the power of your data and transform it into actionable insights. Reach out to Doescher Group today and let's start turning your data into a competitive advantage.